Complete Metrics Dashboard Redesign: July 2025 Release
We've completely redesigned our metrics dashboard with a modern card-based interface, dual view system, and enhanced data visualization. Get deeper insights into your email performance with our most comprehensive metrics update yet.
New Metrics Dashboard Overview
Timeline View
Trend View

Our completely redesigned metrics dashboard features a modern card-based interface, dual visualization modes, and comprehensive performance tracking. Switch between Timeline and Trend views to get the insights you need for data-driven decisions.
Performance Overview Cards
Our new card-based design provides instant visibility into your key email metrics. Each card is color-coded and includes contextual information to help you understand your performance at a glance.
Six Key Metrics:
- Total Sent: Complete count of emails sent in the selected period
- Delivery Rate: Percentage of emails successfully delivered with exact count
- Open Rate: Engagement metric showing how many recipients opened your emails
- Click Rate: Conversion metric tracking link clicks within your emails
- Bounce Rate: Quality indicator showing delivery failures
- Complaint Rate: Reputation metric tracking spam complaints
Visual Improvements:
- • Color-coded icons for instant recognition
- • Large, easy-to-read percentage displays
- • Detailed counts for context (e.g., "47.9K delivered")
- • Clean, modern card design
Dual View System: Timeline & Trend
Choose between two powerful visualization modes to analyze your email performance. Switch seamlessly between timeline and trend views to get the insights you need.
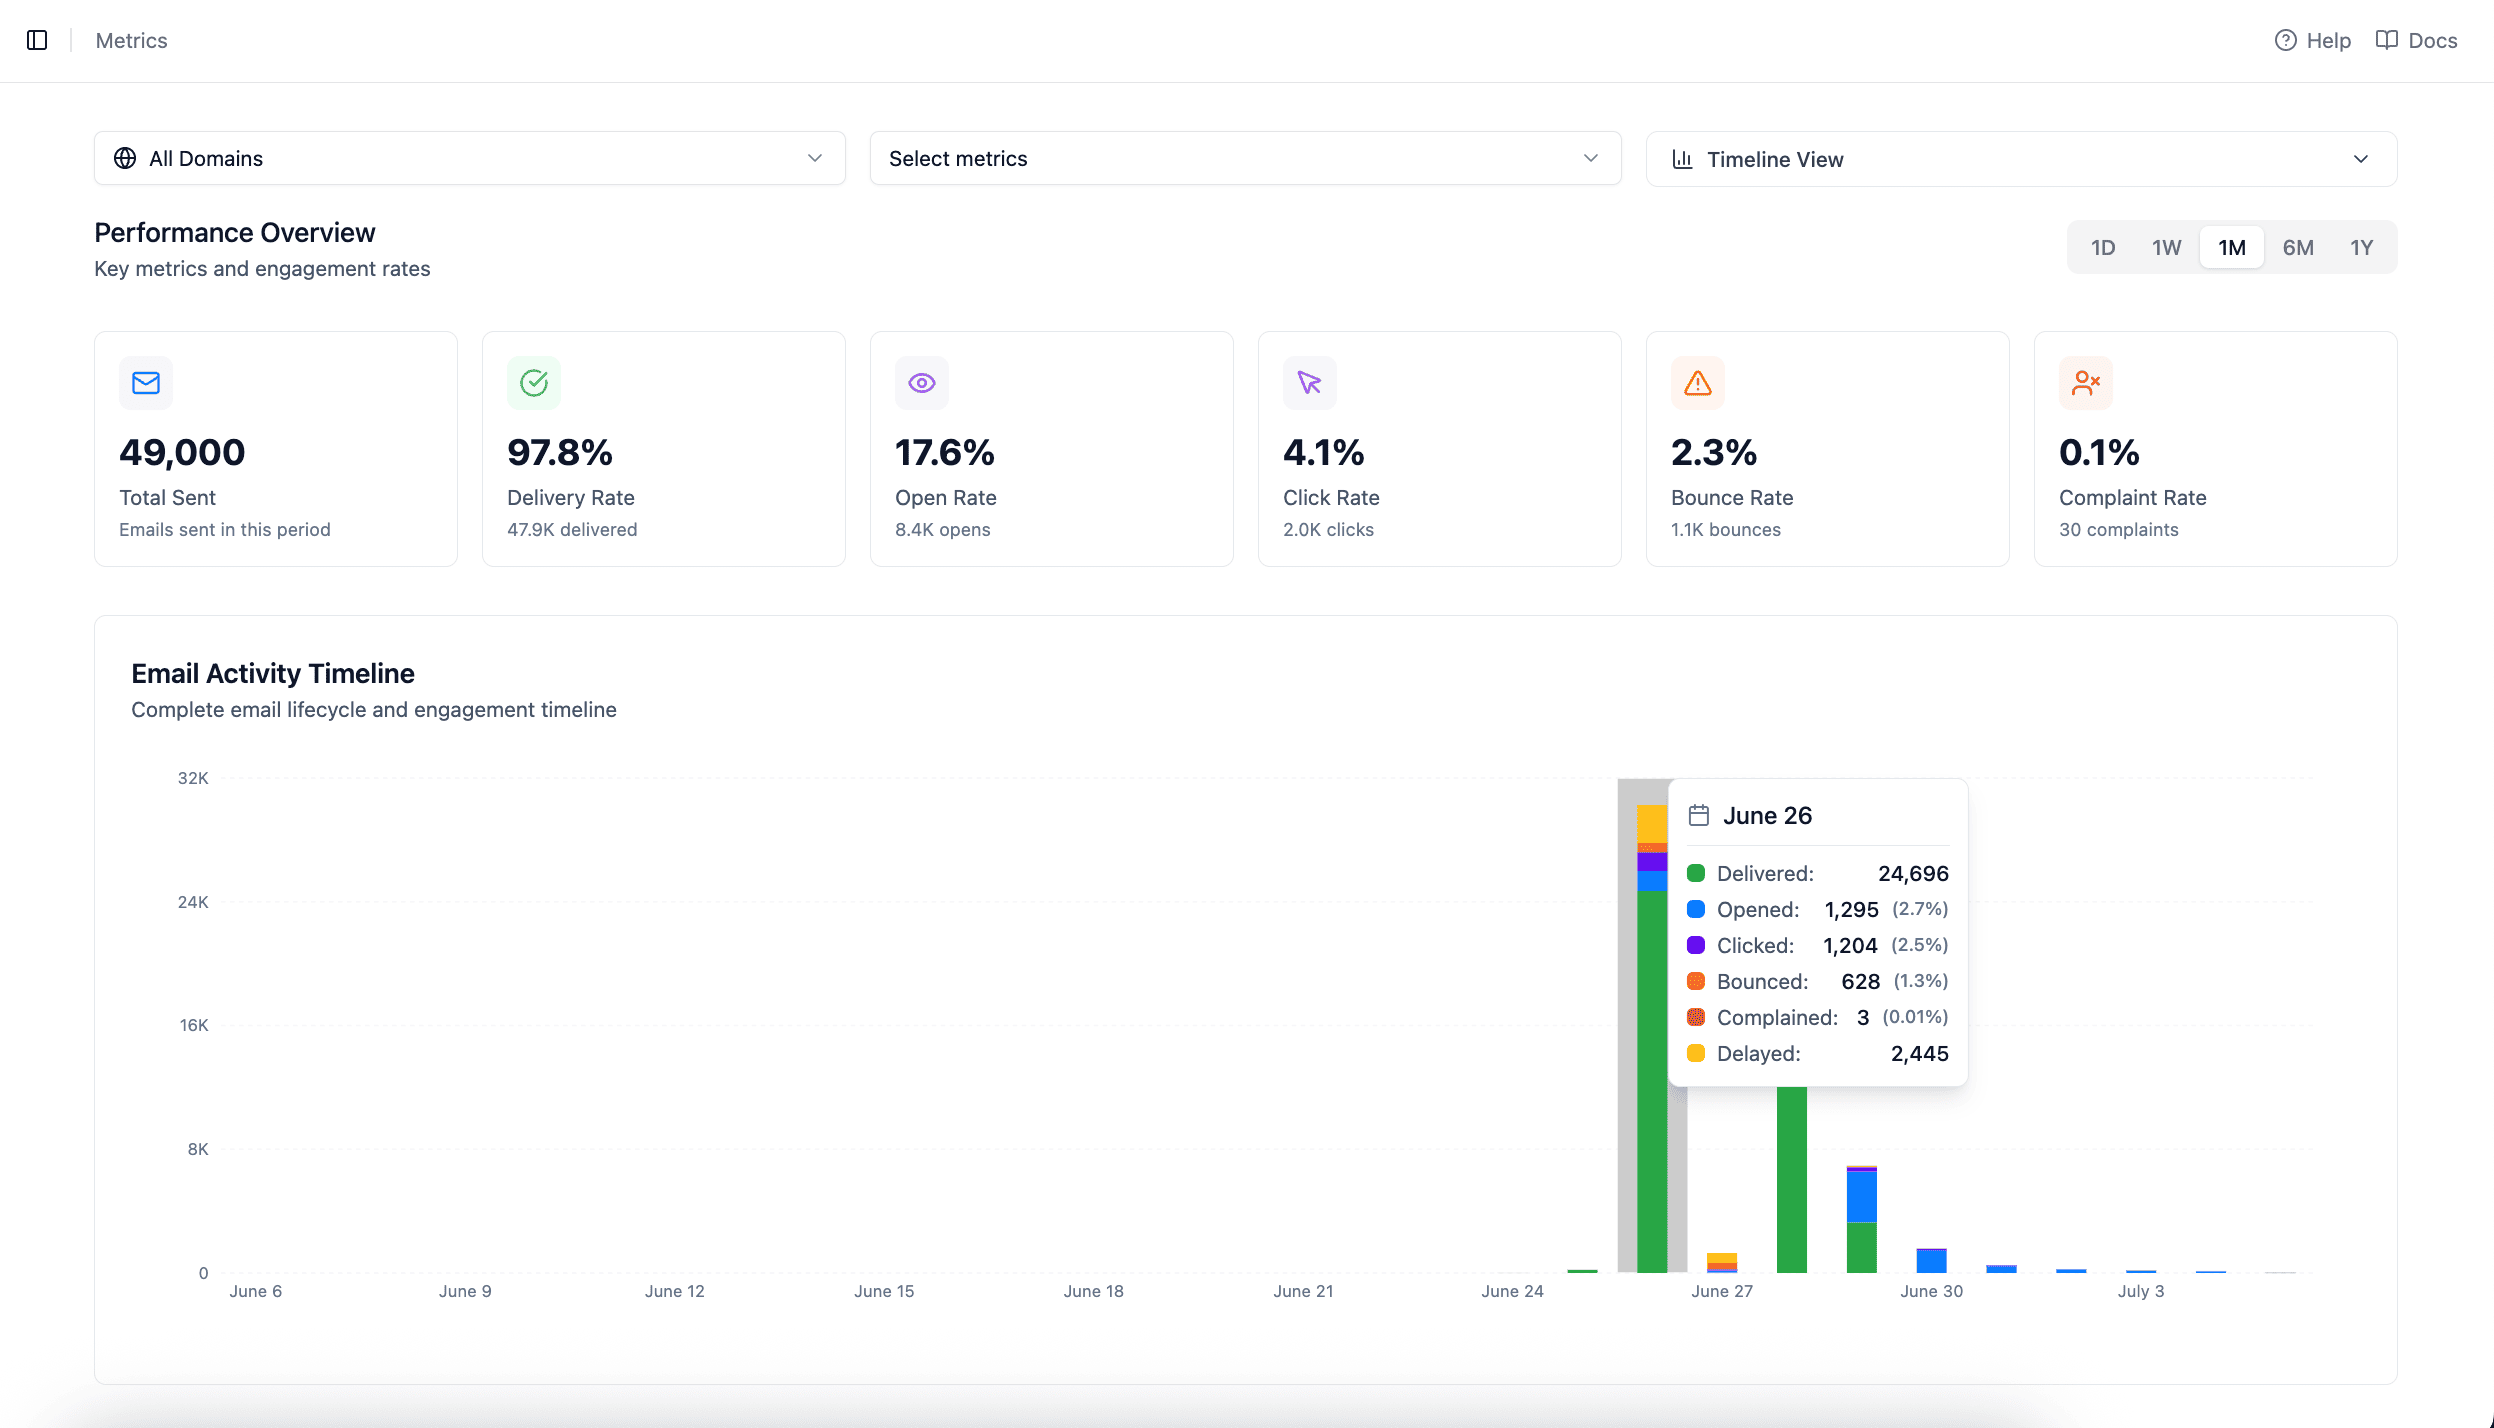
Timeline View
The timeline view shows your complete email lifecycle and engagement timeline, perfect for understanding email flow and activity patterns.
- Email Activity Timeline: Visual bar chart showing delivered, opened, clicked, bounced, and complained emails
- Comprehensive Legend: Color-coded legend for easy interpretation
- Daily Breakdown: See activity patterns across specific dates
- Stacked Visualization: Understand the complete email journey in one view
Trend View
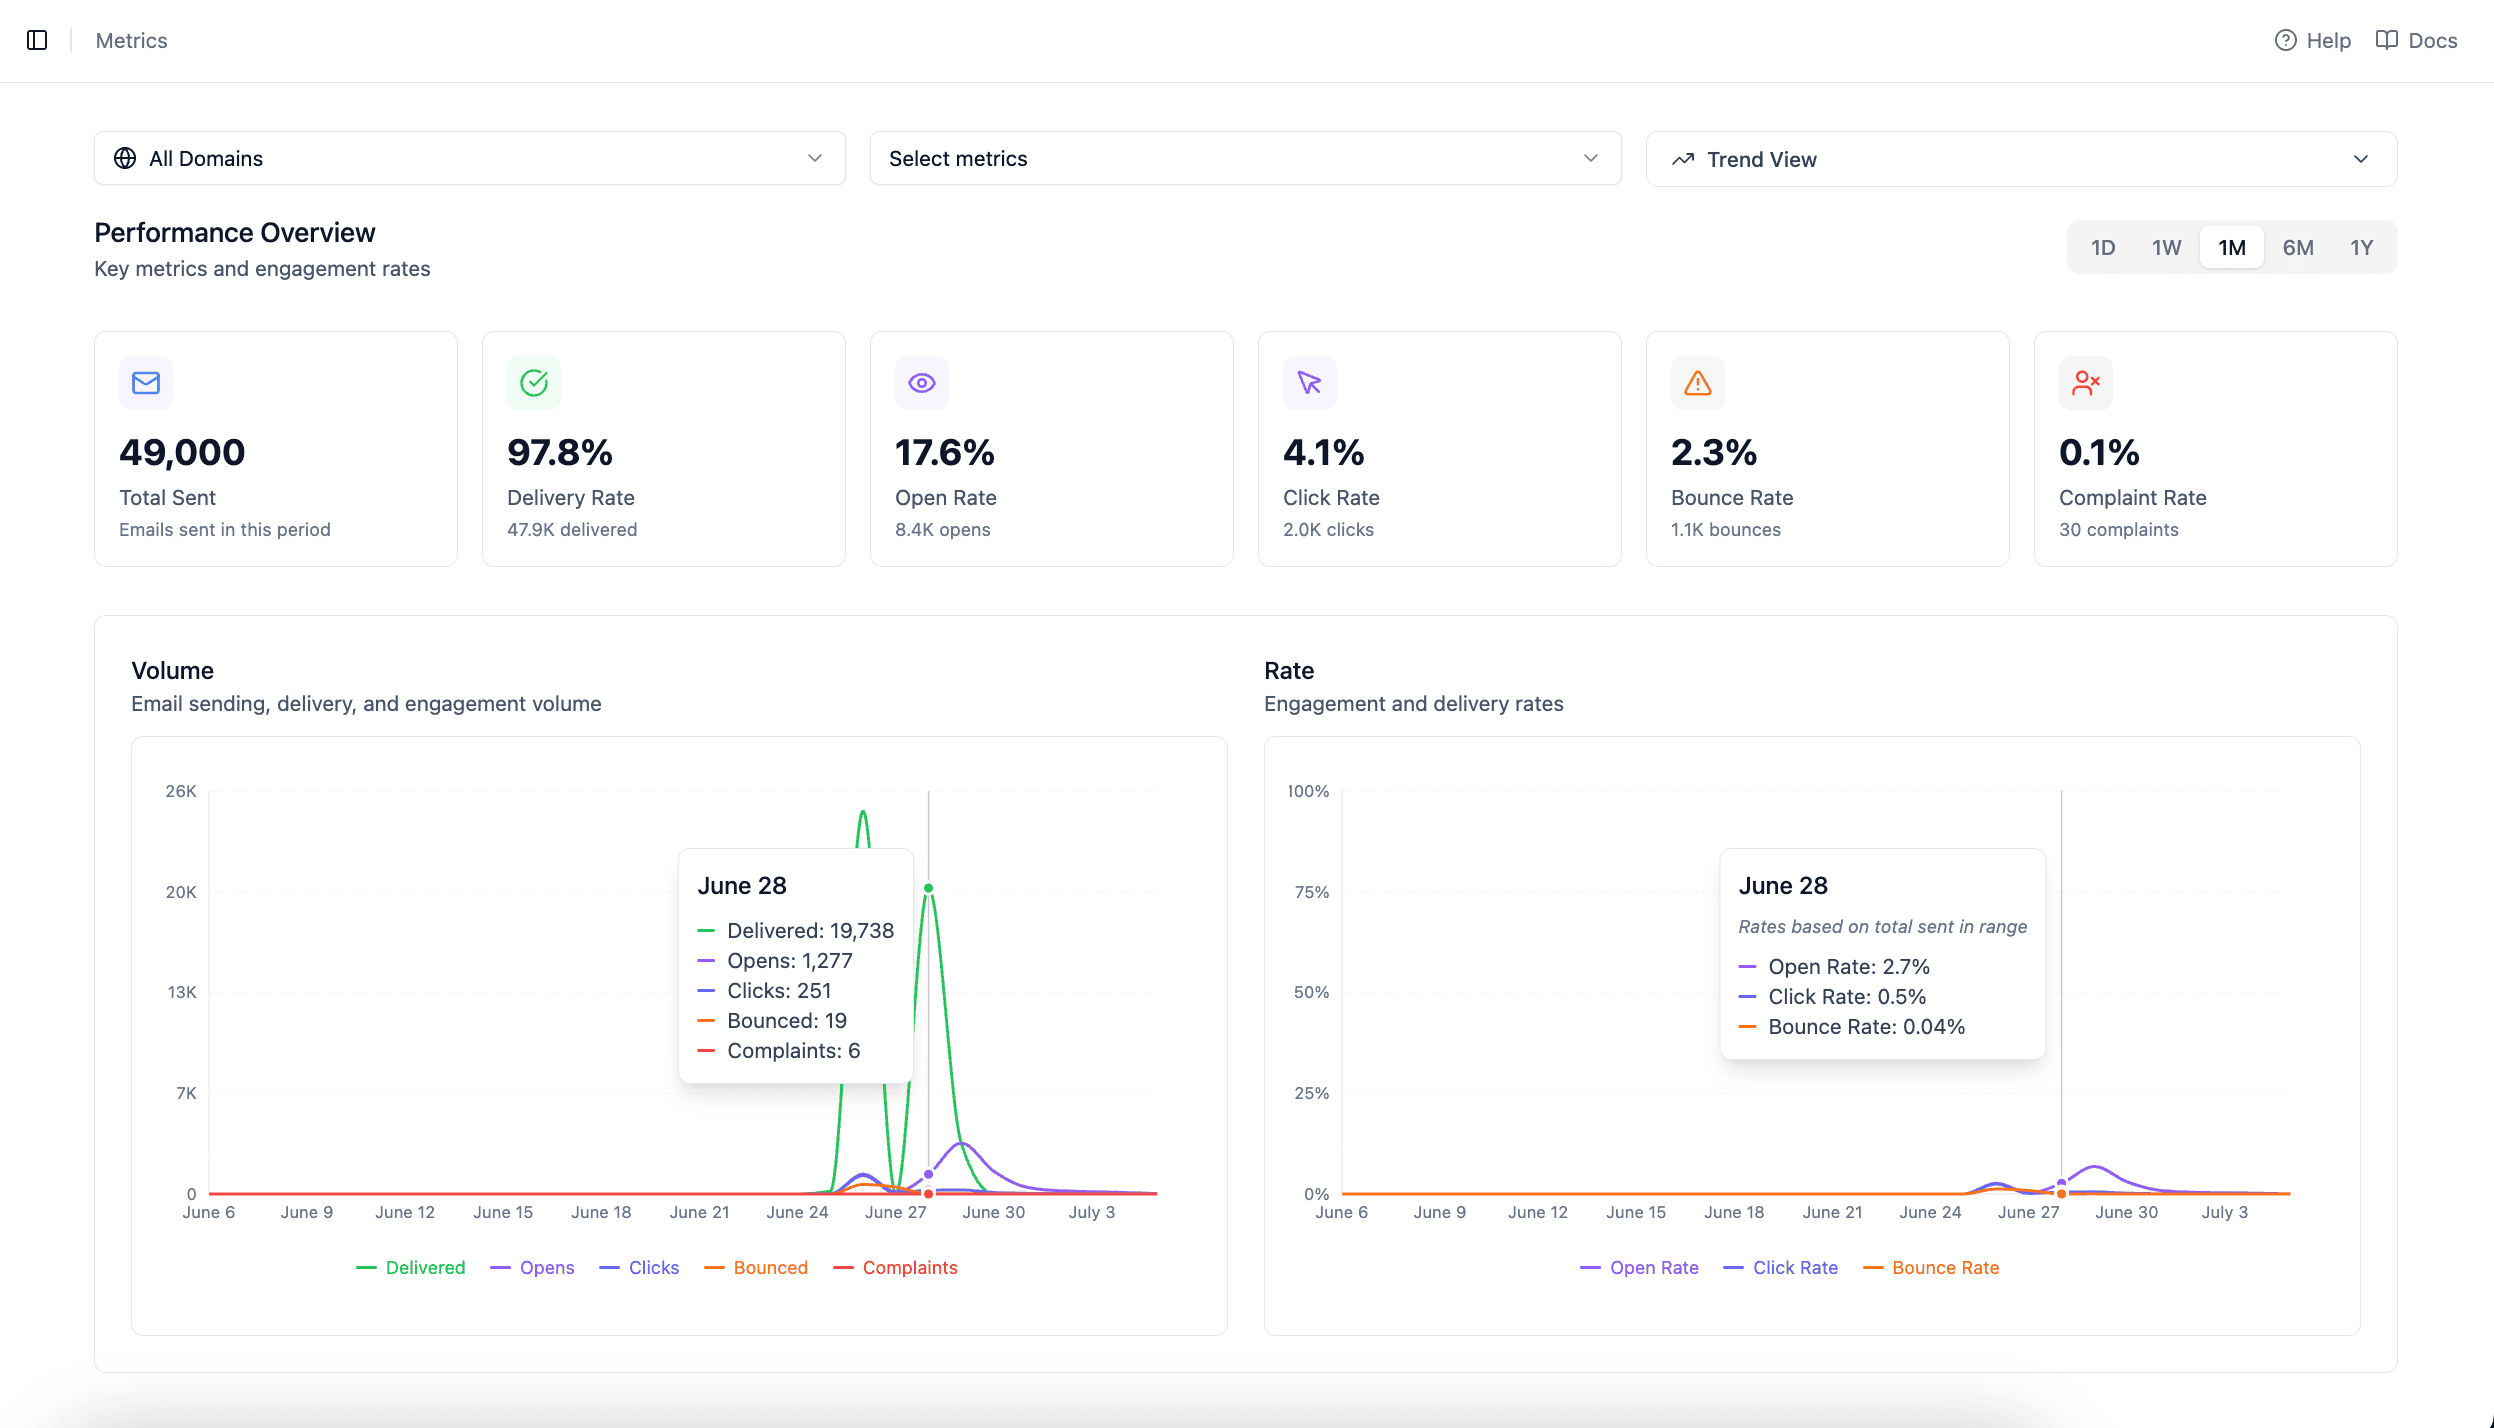
The trend view provides dual-axis analysis with volume metrics on the left and rate metrics on the right, perfect for identifying patterns and optimizing performance.
- Volume Analysis: Track delivered, opened, clicked, bounced, and complained volumes over time
- Rate Analysis: Monitor open rate, click rate, and bounce rate trends
- Dual-Axis Charts: Separate volume and rate scales for accurate analysis
- Interactive Tooltips: Hover over data points for detailed information
- Peak Analysis: Easily identify high-performance periods and optimization opportunities
When to Use Each View:
Timeline View: Best for understanding email lifecycle, identifying activity patterns, and seeing the complete engagement story.
Trend View: Perfect for performance analysis, identifying trends, and optimizing campaigns based on rate patterns.
Enhanced User Experience
Every aspect of the new metrics dashboard has been designed with clarity and ease of use in mind. From intuitive navigation to comprehensive filtering options.
Key Improvements:
- Intuitive Navigation: Simple toggle between Timeline and Trend views
- Smart Filtering: Filter by domain, time range, and specific metrics
- Responsive Design: Perfect display on all devices and screen sizes
- Clear Visual Hierarchy: Important metrics stand out with proper emphasis
- Consistent Color Coding: Same colors across all charts and views
- Comprehensive Tooltips: Hover for detailed information without clutter
- Fast Loading: Optimized for quick data retrieval and rendering
Built for Decision Making:
The new design isn't just about looking good - it's about making data-driven decisions easier. Every element has been positioned and styled to help you quickly identify trends, spot issues, and optimize your email performance.
Flexible Time Range Analysis
Analyze your email performance across different time periods with our enhanced time range selector. From daily insights to yearly trends, get the perspective you need.
Available Time Ranges:
- 1D (Daily): Hour-by-hour breakdown for detailed daily analysis
- 1W (Weekly): Daily data points for weekly performance review
- 1M (Monthly): Daily aggregation for monthly trends
- 6M (6 Months): Weekly aggregation for medium-term analysis
- 1Y (Yearly): Monthly aggregation for annual performance review
Smart Data Aggregation:
Our system automatically adjusts data granularity based on your selected time range, ensuring charts remain readable while providing the right level of detail for your analysis needs.